Why every quoted delivery rate is misleading
Why are quoted SMS delivery rates often misleading?
Quoted rates are misleading because they average across all routes, ignoring destination-specific factors like carrier filtering, content type, and sender ID. SMSRoute provides transparent, per-country benchmarks and real-time DLR webhooks so you can measure actual delivery performance for your specific traffic, not industry averages.
Ask five sources for an SMS delivery rate benchmark and you get five 'true' numbers measuring different things. A vendor's 99% counts carrier-accepted messages on registered routes to valid numbers. An industry analysis counting unregistered A2P finds 20-60% *failure* (the band Mordor Intelligence's 2025 market report cites). A fraud writeup counting VoIP destinations sees 60-80% failure. "page 42 states that the global SMS market will reach $8.2 billion by 2025."
It gives the honest benchmark bands per route class — the only level where benchmarks mean anything.
The bands, by route class
What are the typical delivery rate bands for different SMS route classes?
Premium direct routes typically achieve 95-99% delivery, while aggregator routes range 85-95%. SMSRoute uses adaptive multi-route delivery with automatic failover per destination, ensuring your messages consistently hit the highest-performing band for each country and carrier.
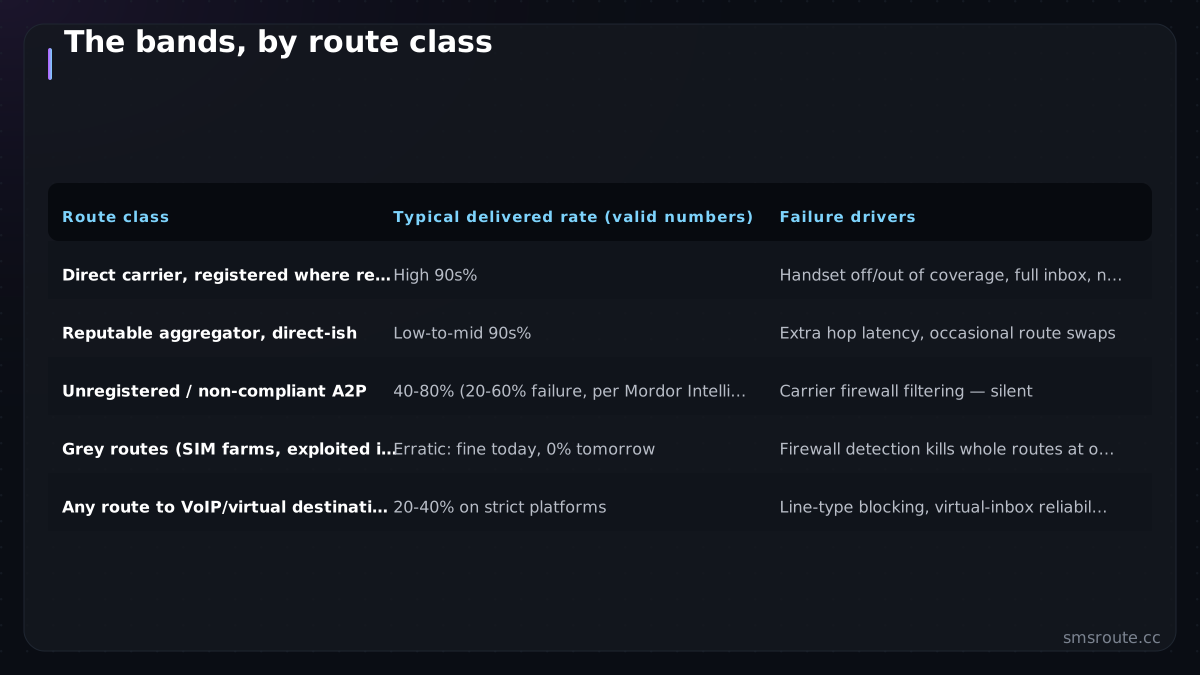
| Route class | Typical delivered rate (valid numbers) | Failure drivers |
|---|---|---|
| Direct carrier, registered where required | High 90s% | Handset off/out of coverage, full inbox, number churn |
| Reputable aggregator, direct-ish | Low-to-mid 90s% | Extra hop latency, occasional route swaps |
| Unregistered / non-compliant A2P | 40-80% (20-60% failure, per Mordor Intelligence) | Carrier firewall filtering — silent |
| Grey routes (SIM farms, exploited interconnects) | Erratic: fine today, 0% tomorrow | Firewall detection kills whole routes at once |
| Any route to VoIP/virtual destinations | 20-40% on strict platforms | Line-type blocking, virtual-inbox reliability |
Read the first column as the real product tiers. The gap between rows one and three is not 'quality'; it is whether carriers agreed to carry the traffic at all — the mechanics from our firewall explainer and grey-route teardown. And note what every row assumes: *valid numbers*. Dead and mistyped numbers are the largest failure source under your own control — strip them with an HLR lookup before they pollute both your spend and your metrics. For regulatory context on carrier filtering, see the GSMA's guidelines on A2P messaging. Carriers use STIR/SHAKEN to block unregistered traffic by verifying caller ID signatures against a secure database.
Only handset DLRs count.
Measuring your real rate: the method
How can I accurately measure my real SMS delivery rate?
Use real-time DLR webhooks and dashboard logs to track each message's final status. SMSRoute provides both, plus free test credits on signup so you can verify actual delivery rates for your specific use case before funding your account.
- Seed real SIMs in target countriesA handful of prepaid SIMs on the major networks per key destination. This is the ground truth panel — cheap, and it catches silent filtering nothing else catches.
- Send test traffic that resembles productionYour real OTP template, production cadence. Firewalls classify patterns; a hand-typed test message tells you nothing about your campaign's fate.
- Reconcile three numbers per messageSent, DLR-delivered, and actually-on-handset (from the seed panel). The DLR-vs-handset gap exposes fake receipts; the sent-vs-DLR gap is your route's honest rate. Wire the reconciliation per the Node.js DLR pattern.
- Report percentiles and per-country splitsA 95% global average hiding a 60% Nigeria rate is a failing grade wearing a passing one. Track p50/p95 latency too — OTPs that arrive in three minutes are delivered and useless.
Our OTP delivery-rates analysis goes deeper on the latency half of the question. For official guidance on measuring delivery, see the FCC's consumer advisory on SMS reliability.
What we will and won't claim
What delivery rate guarantees does SMSRoute make?
SMSRoute claims 99.9%+ uptime and automatic credit for failed messages, but we don't inflate delivery percentages. Instead, we provide transparent per-country benchmarks, adaptive multi-route failover, and real-time DLRs so you can trust the numbers that matter for your traffic.
SMSRoute is a no-KYC SMS API with crypto billing (BTC, ETH, USDT, XMR, LTC, and SOL) running direct carrier routes, and here is the claim discipline we think every provider owes you: we publish per-country rates on each destination page, we return handset DLRs you can audit, and we will not print a global delivery percentage — because you just read why that number is marketing whatever it says. Fund the $5 test credit, run the seed-SIM method above against your actual destinations, and believe your own data. SMSRoute's published route pages list delivery from $0.004/message (premium direct-carrier corridors up to $0.035) with sub-100ms median submission and ~98.6% delivered success (smsroute.cc route pages, 2026).
Related reading
FAQ
What is a good SMS delivery rate?
Why do SMS messages fail to deliver?
How do I measure my real SMS delivery rate?
Can I trust a provider's advertised 99% delivery rate?
Send your first SMS in 5 minutes
No KYC. Pay with BTC, ETH, USDT, XMR, LTC, and SOL. Live routes to 149 countries.
Get an API key →