The per-message rate isn't your OTP cost
Real OTP SMS cost is per *successful verification*, and that number is higher than the message rate. It's higher because of retries, failed deliveries, wrong-number waste, and a per-country mix that a single rate hides.
What drives real OTP cost
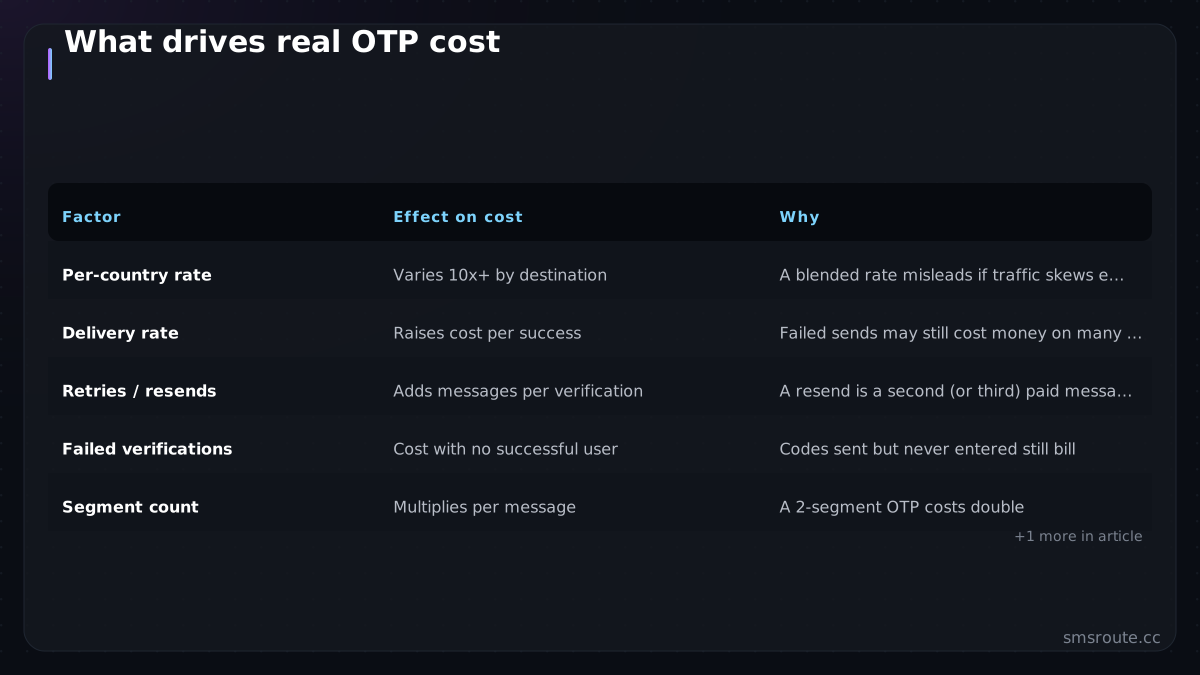
| Factor | Effect on cost | Why |
|---|---|---|
| Per-country rate | Varies 10x+ by destination | A blended rate misleads if traffic skews expensive |
| Delivery rate | Raises cost per success | Failed sends may still cost money on many routes |
| Retries / resends | Adds messages per verification | A resend is a second (or third) paid message |
| Failed verifications | Cost with no successful user | Codes sent but never entered still bill |
| Segment count | Multiplies per message | A 2-segment OTP costs double |
| Number validation | Small cost, big savings | Cheaper than sending to a dead number |
The gap between message rate and true spend comes from the middle rows. If 5% of sends fail, you may still pay for those with no verification depending on your provider's billing model. If a fraction need a resend, that's an extra message each. And failed verifications (codes sent to real numbers but never entered) are pure cost. Add it up and cost-per-successful-verification ca
Calculating your real number
- Start with per-country rates, weightedSplit expected OTP volume by destination and use each country's live rate. The international cost logic (Twilio pricing, 2026) applies. A blended average can mislead if your traffic skews to expensive markets.
- Divide by delivery rateIf 95% deliver, divide the message cost by 0.95 to get cost per delivered message. Measure your real delivery rate per corridor. The benchmark method (GSMA, 2026) is better than assuming.
- Add resend and retry factorEstimate the fraction needing a resend and add those messages. One resend on 20% of sends adds 0.2 messages per verification.
- Divide by verification rateCodes sent but never entered still cost. If 80% of delivered codes get verified, that's the final divisor for cost per successful verification. A drop here signals pumping (SMSRoute fraud detection guide, 2026).
curl -X POST https://api.smsroute.cc/sms/send \
  -H "Authorization: Bearer YOUR_API_KEY" \
  -H "Content-Type: application/json" \
  -d '{"to": "+1234567890", "from": "YourBrand", "message": "Your OTP is 123456"}'
A powerful lever is validation. Every OTP sent to an invalid or dead number pays the full cost for zero verifications, so pre-send number validation (a fraction of a message) removes a wasteful category of spend. Cheap check, real savings.
Estimating cost on SMSRoute
SMSRoute is a no-KYC SMS API with crypto billing (BTC, ETH, USDT, XMR, LTC, and SOL) with live per-country pricing on every destination page and an SMS calculator to estimate message spend by country and volume. SMSRoute's published route pages list delivery from $0.004/message (premium direct-carrier corridors up to $0.035) with sub-100ms median submission and ~98.6% delivered success (smsroute.cc route pages, 2026). Start there for the message rate, then layer the real-cost factors on top: your measured delivery rate, your resend fraction, your verification rate. That gives cost-per-successful-verification, the number to budget with.
Real OTP cost is per verification, inflated by delivery loss, retries, and failed entries, and shaped by your country mix. Calculate it properly and you budget on reality. The calculation itself points at savings, because it shows validation and delivery quality doing more for your cost than shaving the per-message rate ever could.
FAQ
How do I calculate the real cost of an OTP SMS?
Why is my OTP cost higher than the per-message rate?
What's a good way to lower OTP costs?
How do I estimate OTP SMS spend by country?
Send your first SMS in 5 minutes
No KYC. Pay with BTC, ETH, USDT, XMR, LTC, and SOL. Live routes to 149 countries.
Get an API key →