Why averages lie about OTP
Why are average OTP delivery times misleading?
Averages hide the tail — the slowest 5% of messages that cause user frustration. A 2-second average can mask 30-second outliers. SMSRoute uses percentile-based benchmarks (P50, P95, P99) to give you real insight into delivery reliability, ensuring your OTP flow is optimized for the worst case, not just the typical one.
OTP delivery time has a brutal user-experience cliff. Users wait on the code-entry screen for a handful of seconds; past roughly ten, they hit resend or leave. So the number that matters is not your average. It is the latency of your *slowest common* deliveries. A route averaging 4 seconds with a p95 of 40 fails one user in twenty at the exact moment they tried to sign up. The average says everything is fine. The funnel says otherwise. For the authoritative reference, see NIST SP 800-63B.
This is why we publish a measurement method rather than a marketing number. Any provider's latency claim (ours included) is an average over someone else's traffic mix. Your corridors, your templates, your answer.
The seed-SIM method
What is the seed-SIM method for testing OTP delivery?
The seed-SIM method uses real SIM cards in target countries to measure actual delivery times, bypassing carrier simulation. SMSRoute supports this approach across 149 countries, letting you test with live routes and crypto billing. This gives you accurate, actionable data to optimize your OTP flow for real-world conditions. For Nigeria, buy MTN and Glo prepaid SIMs from a local reseller or eBay. Activate them with a cheap phone before inserting into the seed device.
- Build the panelPrepaid SIMs on each major network in your top destinations, in real handsets (emulated receivers miss carrier-level behavior). Five countries, two to three networks each, is a realistic starter panel.
- Automate timestamped sendsSend your production OTP template on a schedule — hourly for a week captures time-of-day and weekend effects. Record the API-accept timestamp per message id; the Node.js send pattern needs one extra log line.
- Capture arrival honestlyAn Android app or notification-forwarding tool logs handset arrival time per SIM. Handset arrival, not DLR time — the DLR can lag or lead what the user actually experiences.
- Compute per-corridor percentilesp50, p90, p95, p99 per country-network pair. Then reconcile against DLRs: messages with a DLR but no handset arrival are your fake-receipt or filtering detector, straight out of the delivery benchmark method.
A week of hourly sends to a 12-SIM panel costs a few dollars in messages and yields ~2,000 data points. That's enough to spot patterns and flag problems before they hit your users.
Reading the numbers
How do you interpret OTP delivery time percentiles?
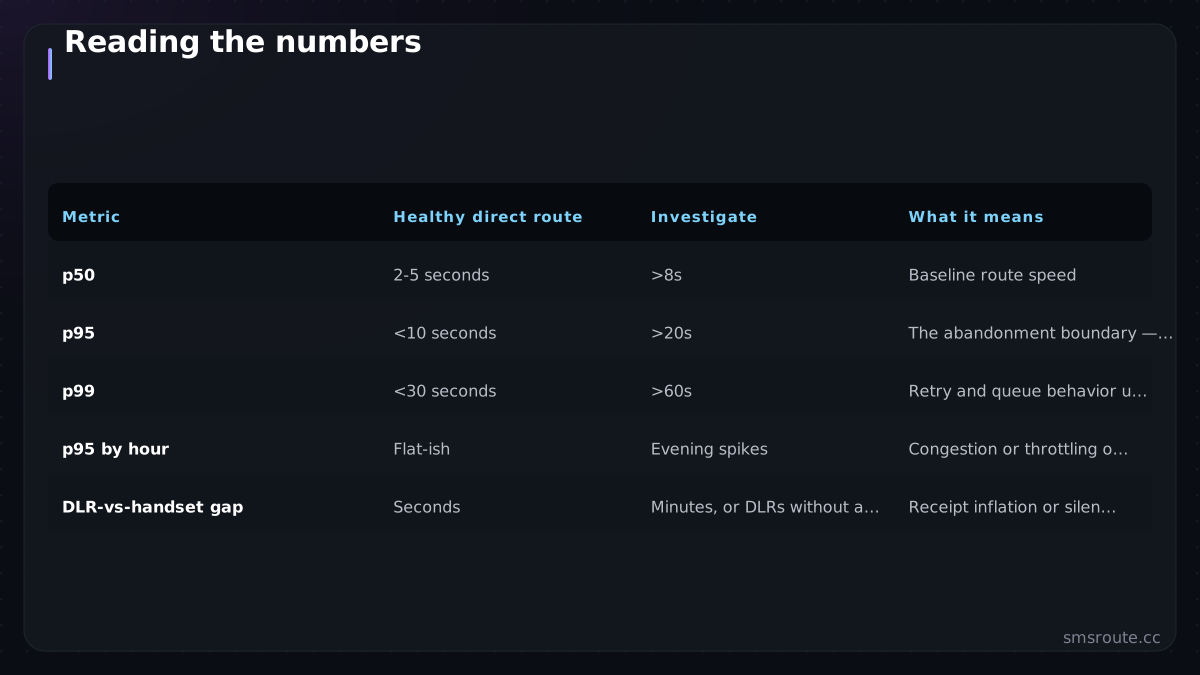
Percentiles show the distribution: P50 is median delivery, P95 means 95% of messages arrive within that time, and P99 captures the slowest 1%. SMSRoute provides real-time DLR webhooks so you can track these metrics per route. This helps you set appropriate timeouts and improve user experience without over-engineering.
| Metric | Healthy direct route | Investigate | What it means |
|---|---|---|---|
| p50 | 2-5 seconds | >8s | Baseline route speed |
| p95 | <10 seconds | >20s | The abandonment boundary — this is the number to optimize |
| p99 | <30 seconds | >60s | Retry and queue behavior under carrier congestion |
| p95 by hour | Flat-ish | Evening spikes | Congestion or throttling on the route |
| DLR-vs-handset gap | Seconds | Minutes, or DLRs without arrival | Receipt inflation or silent filtering |
Two patterns turn up constantly. Evening p95 spikes on one corridor mean shared route congestion — ask your provider whether OTP traffic gets priority routing. A fat gap between p50 and p95 on a single network usually means part of your traffic is taking a slower secondary route. That kind of route behavior can indicate multi-path delivery.
Emerging-market corridors deserve their own baseline: expectations tuned to local network realities, not Western benchmarks.
Designing the flow around measured latency
How should you design OTP flows based on measured latency?
Use P95 as your timeout threshold — it covers 95% of users without unnecessary waiting. SMSRoute's adaptive multi-route delivery automatically fails over to faster routes, keeping your P95 low. With real-time DLR webhooks, you can dynamically adjust retry logic and user messaging based on actual performance data.
SMSRoute is a no-KYC SMS API with crypto billing (BTC, ETH, USDT, XMR, LTC, and SOL), and our standing position is the one this method implies: don't believe latency claims, measure them. The $5 signup credit funds a full week of panel testing against your real corridors before you commit a single production message. SMSRoute's published route pages list delivery from $0.004/message (premium direct-carrier corridors up to $0.035) with sub-100ms median submission and ~98.6% delivered success (smsroute.cc route pages, 2026).
Related reading
FAQ
How fast should an OTP arrive?
Why measure OTP latency in percentiles instead of averages?
How do I test SMS delivery speed to another country?
When should the resend button appear?
Send your first SMS in 5 minutes
No KYC. Pay with BTC, ETH, USDT, XMR, LTC, and SOL. Live routes to 149 countries.
Get an API key →